ABSTRACT: Rare-earth ions doped upconversion nanoparticles (UCNPs) have received great attention for the promising applications ranging from bioimaging and sensing to lighting and displaying technology. Meanwhile, active control of polarization state of the upconversion luminescence (UCL) of UCNPs is also significant in the applications such as polarization microscopy and 3D display. Here, we report the polarization modification for the UCL of β-NaYF4:Yb3+,Er3+nanoparticles by selectively matching the localized surface
plasmon resonance (LSPR) of the rectangular plasmonic slot nanoantenna array to the spectrum of the UCL. The plasmonic resonance band centered at 650 nm of the nanoantenna array realized a strong polarization nature of the selected UCL around 660 nm with the degree of linear polarization up to ∼80%, which stems from the interaction between the 660 nm emission band of UCNPs and the plasmonic modes of the rectangular slot nanoantenna array. Meanwhile, the UCL at 550 nm remained unpolarized due to the mismatch to the plasmonic modes. The experimental results are explained well by theoretical simulations based on the local surface plasmonic resonance. Our results provide an effective way to control the anisotropic UCL of UCNPs with the applications in polarization-based imaging and 3D display technologies and so forth.
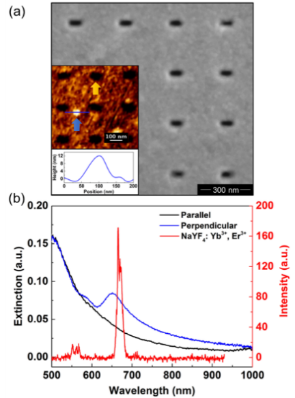
Figure 1. (a) SEM image of rectangular slot nanoantenna array. Inset: AFM topographic image of NaYF4, Yb3+, and Er3+ nanoparticles on the nanoantenna array and the line scan. The blue and yellow arrows indicate the single UCNP and the rectangular slot, respectively. (b) Measured extinction spectrum of the nanoantenna array under the plane-wave illumination with the polarization parallel and perpendicular to the long axis of the slots and the UCL spectrum of NaYF4, Yb3+, and Er3+nanoparticles on glass coverslip.
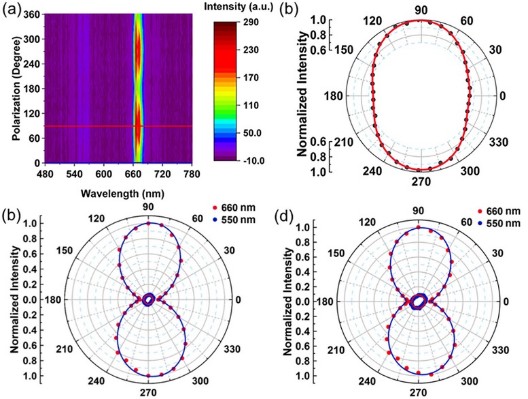
Figure 2. (a) UCL spectra of UCNPs on nanoantenna array as the excitation laser polarization changes. (b) Polar plots of the normalized UCL intensity of UCNPs on nanoantenna array as a function of excitation polarization angle, where the red line is fit for the experimental data. (c) UCL spectra at the excitation polarization of 0° and 90°, respectively. (d) Polar plot of the UCL intensity at different polarization directions under the excitation laser polarization angle at 0° and 90° with fittings.
